[íslenska]
Walkable cities are important part of a healthy and environmentally sustainable lifestyle. In that context it is important to be able to reach a variety of essential services by sustainable mobility modes such as walking, cycling and public transport.
In this data story we look at the services accessible by walking in the Icelandic Capital Area, consisting of the capital itself, Reykjavík and its satellite towns of Seltjarnarnes, Kópavogur, Garðabær, Hafnarfjörður and Mosfellsbær.
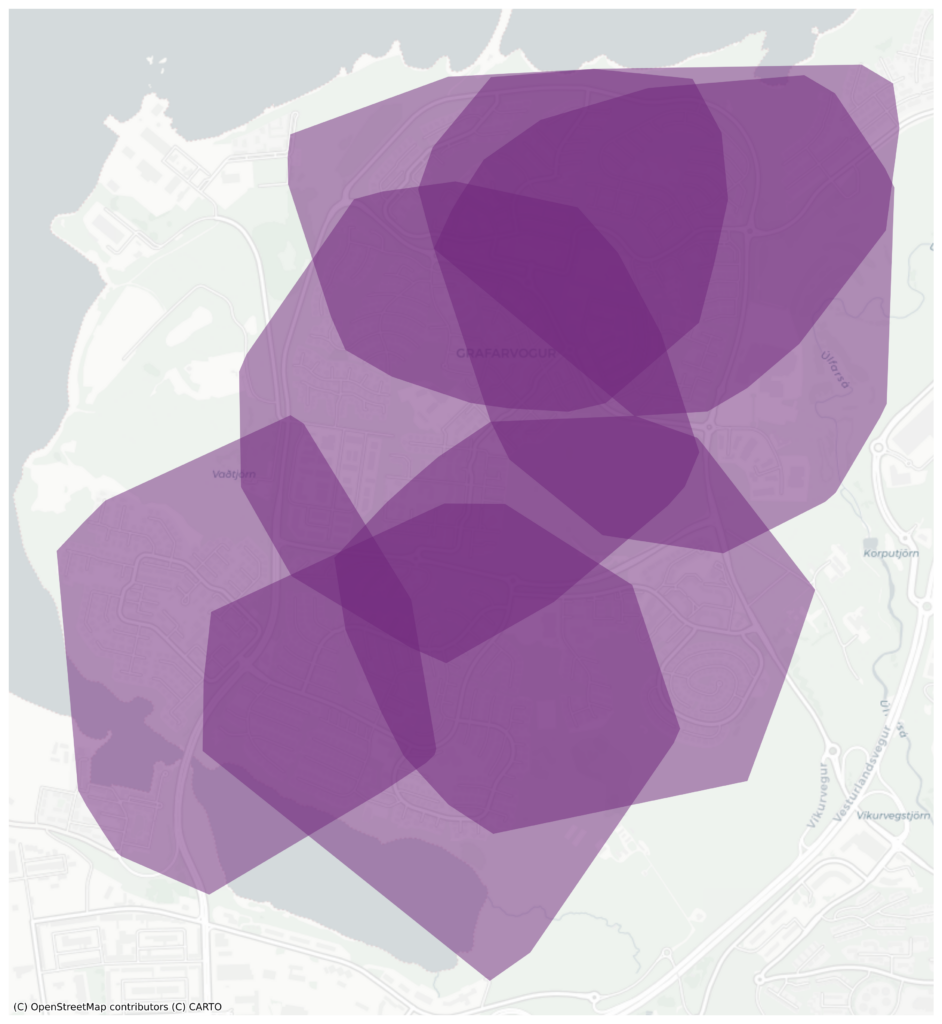
The map below shows the variety of services accessible within a 15 minute walk from different locations within the capital area. The darker an area is, the more variety of series can be reached.
Executive Summary
What is walkability and what to count as an essential service and what not can be defined in many different ways [⛓️💥, ⛓️💥, ⛓️💥]. In the context of this study we look at Primary Schools, Kindergartens, Primary Care Centers (GPs), Grocery Stores, Pharmacies, Cultural Venues, and as a special aspect of the Icelandic cultural heritage, Public Swimming Pools, using data open source geographic data from three Icelandic Public Bodies: the Icelandic Regional Development Institute, the Icelandic Tourist Board, and the Directorate of Health.
For different areas of the Capital Area we calculate how many distinct types of services can be accessed within a 15-minute walk and turn that information into a service access level score for a hexagonal tiling grid.
In the map we can see the decentralized nature of the Capital Area. The main clusters of 100% service access level are the oldest and/or most central areas of the six municipalities that form the Capital Area. The areas with low scores (10-30%) are a mix of new and older neighborhoods. The areas with 0 scores are mostly industrial zones and outer edges of peninsular residential areas.
Kindergartens and Primary Schools are the service types most widely accessible by 15-minutes of walking, being respectively accessible from 84% and 76% of the tiles covering the built environment. Grocery Stores are are accessible from 59% of the tiles and Primary Care Centers from 35%.
Although walkability is a complex subject with many contributing factors we hope that this data story can feed into the discussion about making our cities more sustainable.
Custom urban data analysis
This story is provides high level insights drawn from the analysis of one or more open source urban data-sets. In case you find this story interesting, please contact us for more information as well as pricing and availability of a custom urban data analysis.
Full Report
In the remainder of this post we provide a more in-depth discussion about the Data Sources, Methodology and Results.
Data Sources
The data processing behind this story is built on open source geographic data from three Icelandic public bodies: the Icelandic Regional Development Institute, providing a list of primary schools, kindergartens, grocery stores, pharmacies and swimming pools; the Icelandic Tourist Board, where we got a list of culture venues; and the Directorate of Health, providing a list of all primary care centers.
Open Street Map was used as a basis for calculating distances in the underlying road network and to find names of neighborhoods.
Methodology
After studying the available data we choose seven types of services to take into our calculation. We defined three to be highly essential and assigned them a weight of 20% each:
- Primary Schools
- Primary Care Centers
- Grocery Stores
The remaining four were assigned 10% weight each:
- Kindergartens
- Pharmacies
- Culture Venues
- Swimming Pools
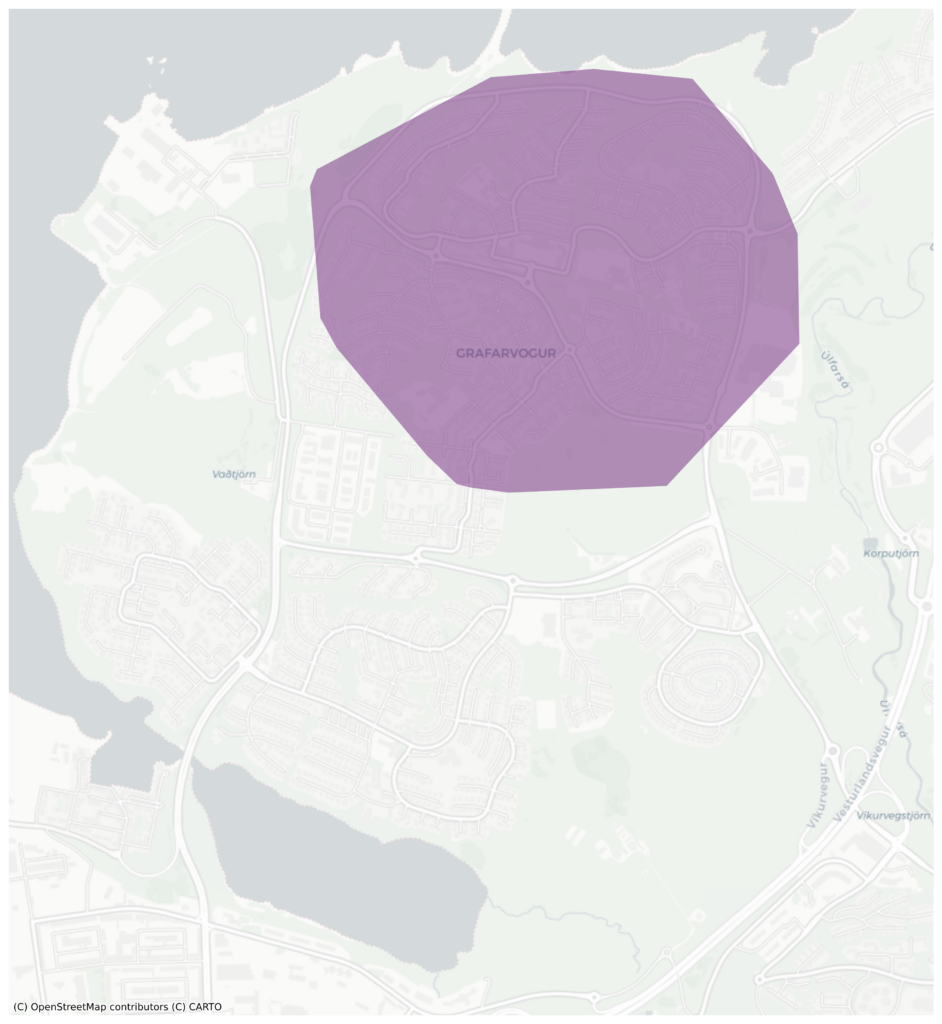
We used the OSMNx Python package to generate a 15 minute catchment area around each point of interest in our dataset. That is, the geographic area that is accessible within 15 minutes of walking from a particular point of interest. The images below show on one hand an example of the catchment areas of 7 primary schools in the Grafarvogur neighborhood of Reykjavík and on the other, the catchment area of the neighborhood primary care center.
Subsequently, we created a base layer of hexagon that covered all the Capital Area. Each hexagon is roughly 300 meters in diameter. We projected all the service types onto this base layer and calculated a Service Access Level score. If a hexagon overlapped with the catchment area of a certain service type, we say that the service type is accessible from that hexagon and the overall service access level of the hexagon is increased according to the weight of the corresponding service type.
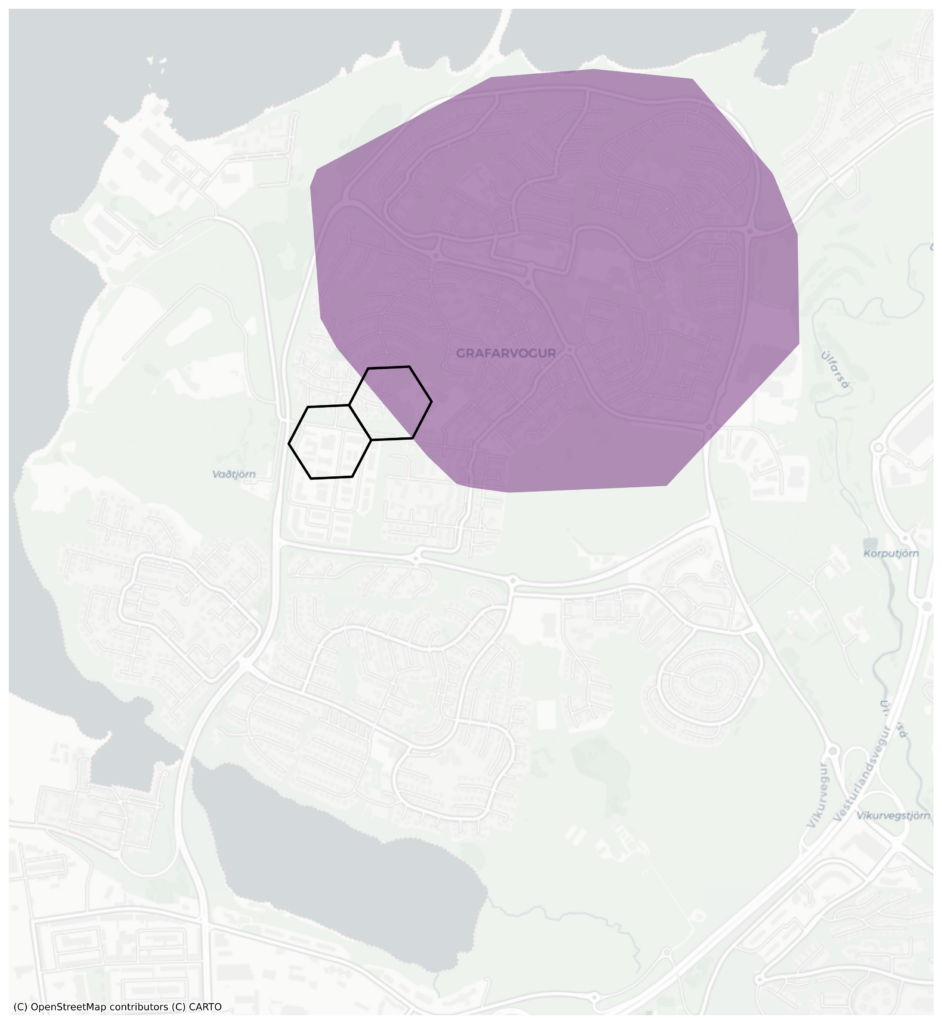
In the image below we see again the catchment area of the primary care center of Grafarvogur, Reykjavík together with two example hexagons. The hexagon on the left does not overlap with the catchment area and thus the contribution of primary care to the overall score of the hexagon is zero.The hexagon on the right does overlap with the catchment area and thus the contribution of primary care to the overall score of the hexagon is 20 percentage points.
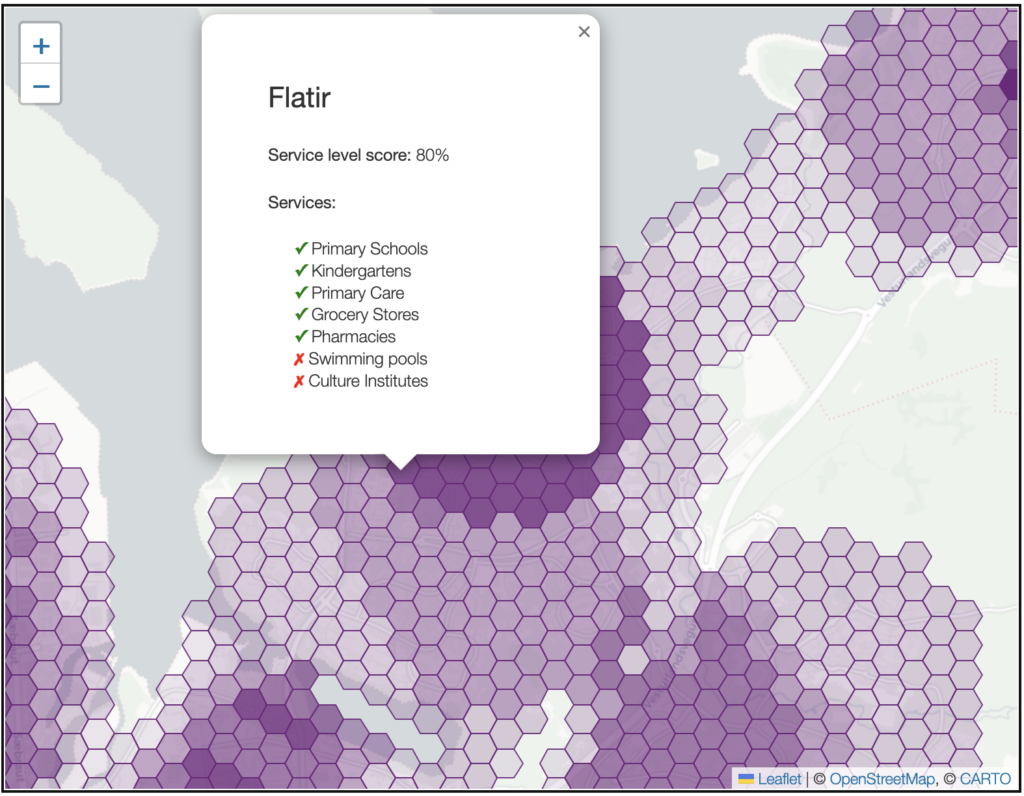
The screenshots below are from the final visualization when all service types have been taken into account.
On one hand there is a hexagon from Grafarvogur neighborhood that overlaps with the catchment areas for a primary school, a kindergarten, primary care center, grocery store, and a pharmacy. Its service access level score is thus 20% + 10% + 20% + 20% + 10% = 80%.
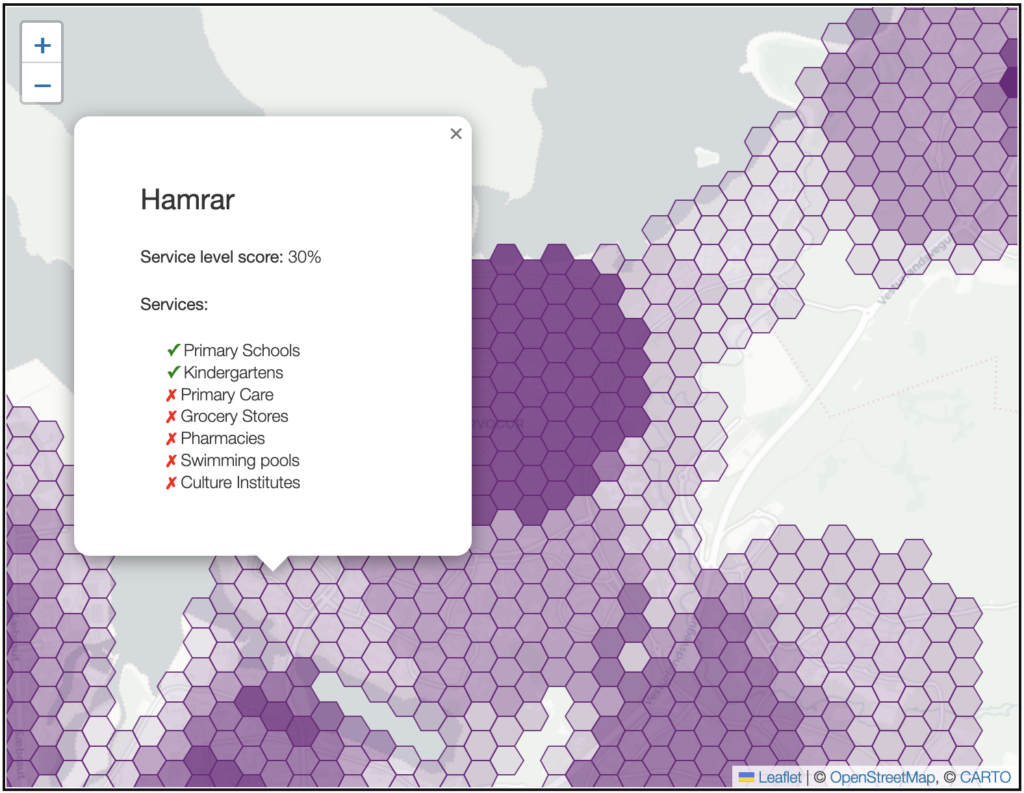
On the other hand there is a hexagon from the Grafarvogur neighborhood that overlaps only with the catchment area of a primary school and a kindergarten and its access level score is thus only 20% + 10% = 30%.
Results and Discussion
In this last section we look at some more numbers coming from our analysis and discuss some findings.
Service types
The table below shows the number of locations for each service type, the total area of their combined catchment area, the number of hexagons the catchment area overlaps with and the hexagon count as a a percentage of all hexagons covering the build-environment. Note that the coverage is geographic and does not take population density into account.
| Locations | Area (km2) | Hexagons | Coverage | |
| Primary Schools | 84 | 80.1 | 1,667 | 76% |
| Kindergartens | 164 | 90.8 | 1,846 | 84% |
| Primary Care Centers | 19 | 32.8 | 766 | 35% |
| Grocery Stores | 78 | 63.4 | 1,298 | 59% |
| Pharmacies | 45 | 52.2 | 1,116 | 51% |
| Swimming Pools | 18 | 31.9 | 752 | 34% |
| Culture Venues | 42 | 29.4 | 646 | 30% |
Of the three higher weighted service types Primary Schools have the highest hexagon coverage (76%), then there are Grocery Stores (59%) and Health Care Centers are last (35%).
The Primary School coverage seems pretty good, taking into account that our analysis contains all the built-environment, including purely industrial areas. The Grocery Store access seems borderline low, but maybe not surprising in a car dependent place where 75% of the population commutes to work as a driver of a private automobile [National Mobility Study 2022]. Again, since the coverage is calculated as a percentage of built-area polygons, it does not reflect the percentage of homes with walkable access to Grocery Stores. In the National Mobility Study referenced above, 74% of participants said they had a Grocery Store within an acceptable walking distance. The Primary Care Center coverage reflects the Icelandic Health Care System where Primary Care is predominantly served in relatively large centers, usually operated by the local authorities.
Data Quality, Completeness and Timeliness
When working with open government data or any other open data it is important to reflect on the principles behind the data publication and the caveats that might hold for the given data usage.
In our usage of the data there are two caveats that we would like to highlight. Both relate to a potential mismatch between the purpose of the data collection and our use. Each public body has its well defined purpose and executes its data gathering accordingly. Although the chosen data is quite suitable for the purpose of this article, it is not the original purpose behind the data collection and might cause some minor misalignment.
The purpose of the Regional Development Institute is to “promote rural settlement and economic activity, with special emphasis on the creation of equal opportunities for all inhabitants to employment and habitation” and it is thus not obvious if its data is suitable for comparing neighborhoods in urban areas. Similarly, the purpose of the Icelandic Tourist Board is to “monitor and promote the development of tourism as an important and sustainable pillar of the Icelandic economy“, and it would not be unreasonable if their data gathering would be biased toward cultural venues that attract tourist and locals alike rather than venues that are predominantly of interest to the local population.
Note that these are only reasonable caveats one should have in mind when working with open public data in general. During the processing of this data there was nothing that indicated that the downloaded data were unsuitable or significantly incomplete for our purposes.
We did not do a deep evaluation of the data completeness but the overall results indicate pretty good coverage. That said, some data is not up to date or incomplete. Some Primary Schools have multiple locations but only one of locations is in the data-set (e.g. Víkurskóli/Kelduskóli). Some new swimming pools are missing (e.g. Dalslaug in Úlfarsárdalur). Not all non-chain supermarkets are present (e.g., OK Market in Hlíðarfótur).
While these minor data completeness issues are unlikely to change the conclusions of this study, they could be complemented by using sources like Open Street Map, but this is left to future work.
Custom urban data analysis
This story is provides high level insights drawn from the analysis of one or more open source urban data-sets. In case you find this story interesting, please contact us for more information as well as pricing and availability of a custom urban data analysis.